
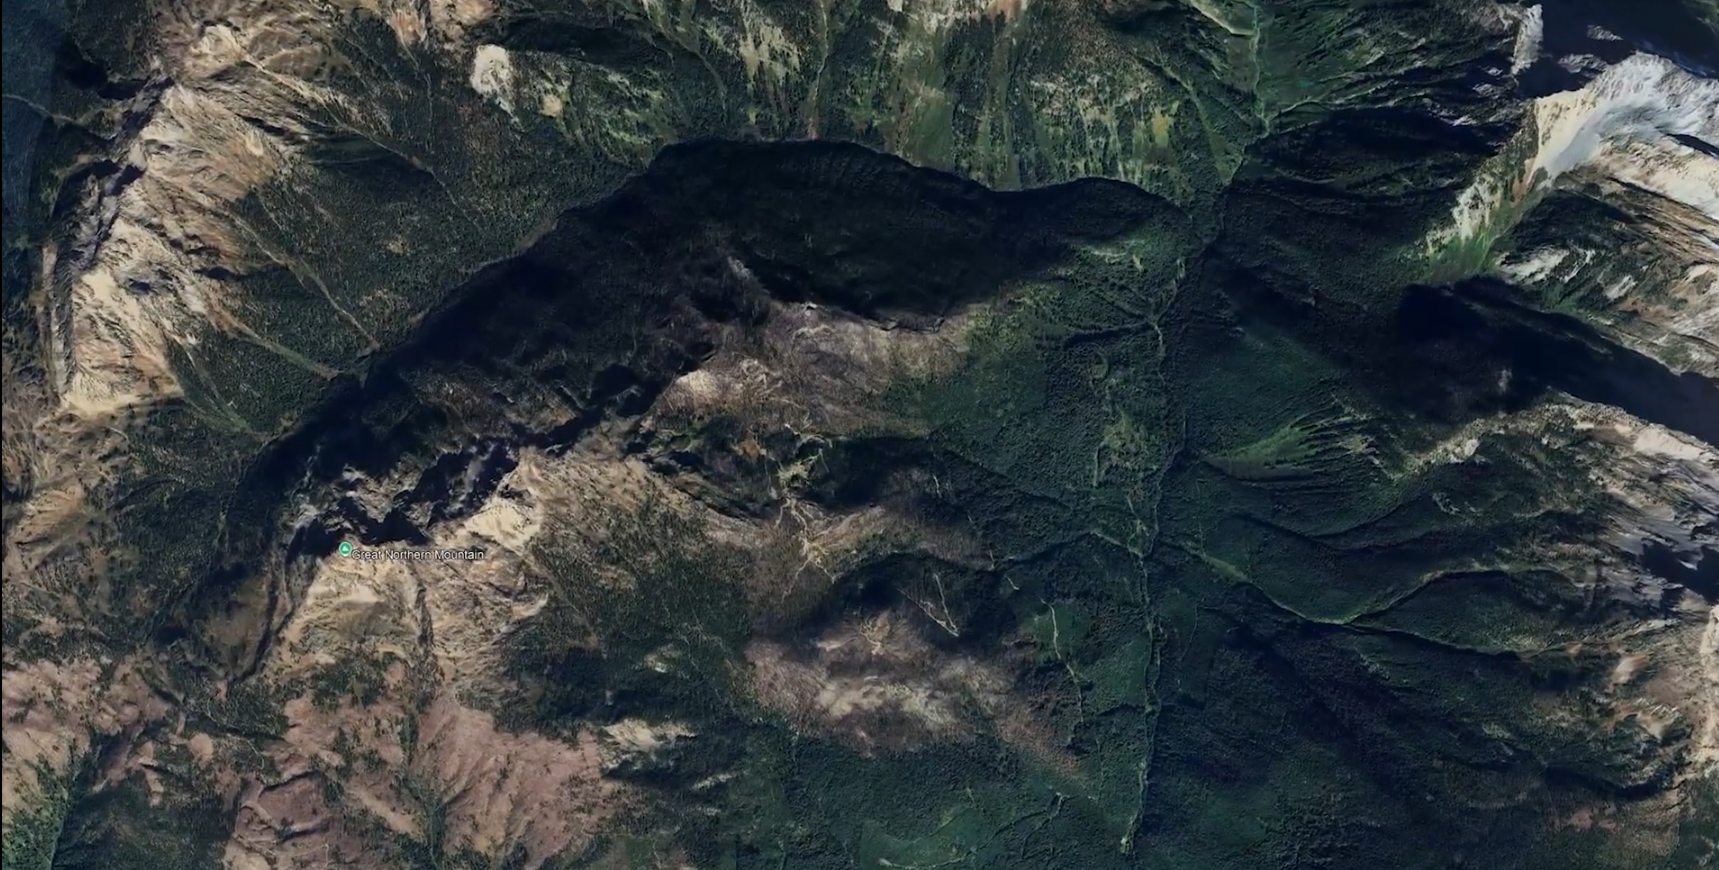
Mountain terrain surrounding the Thor Project in southeastern British Columbia

Thor Mineral Resource · Southeastern British Columbia

A high-grade polymetallic foundation.
District-scale potential.

A defined, independently prepared NI 43-101 Mineral Resource supports the Thor investment thesis while Taranis tests the broader Silver Cup mineral system.

Effective date
26 Feb 2024
Indicated
1.139 Mt
Inferred
0.599 Mt

The core technical foundation

Nearly two decades of definition and de-risking

Thor has been delineated through 271 modern diamond drill holes totaling 19,750 metres, supported by underground channel sampling, trenching and modern topographic control.

The independent April 2024 update incorporated airborne LiDAR and 119 drill holes completed after the maiden 2013 estimate. The result was a reported 78% increase in Indicated resources and a 41% increase in Inferred resources.

The Mineral Resource provides a defined asset base. The surrounding district-scale targets represent separate exploration opportunities and are not included in the Mineral Resource unless expressly stated.
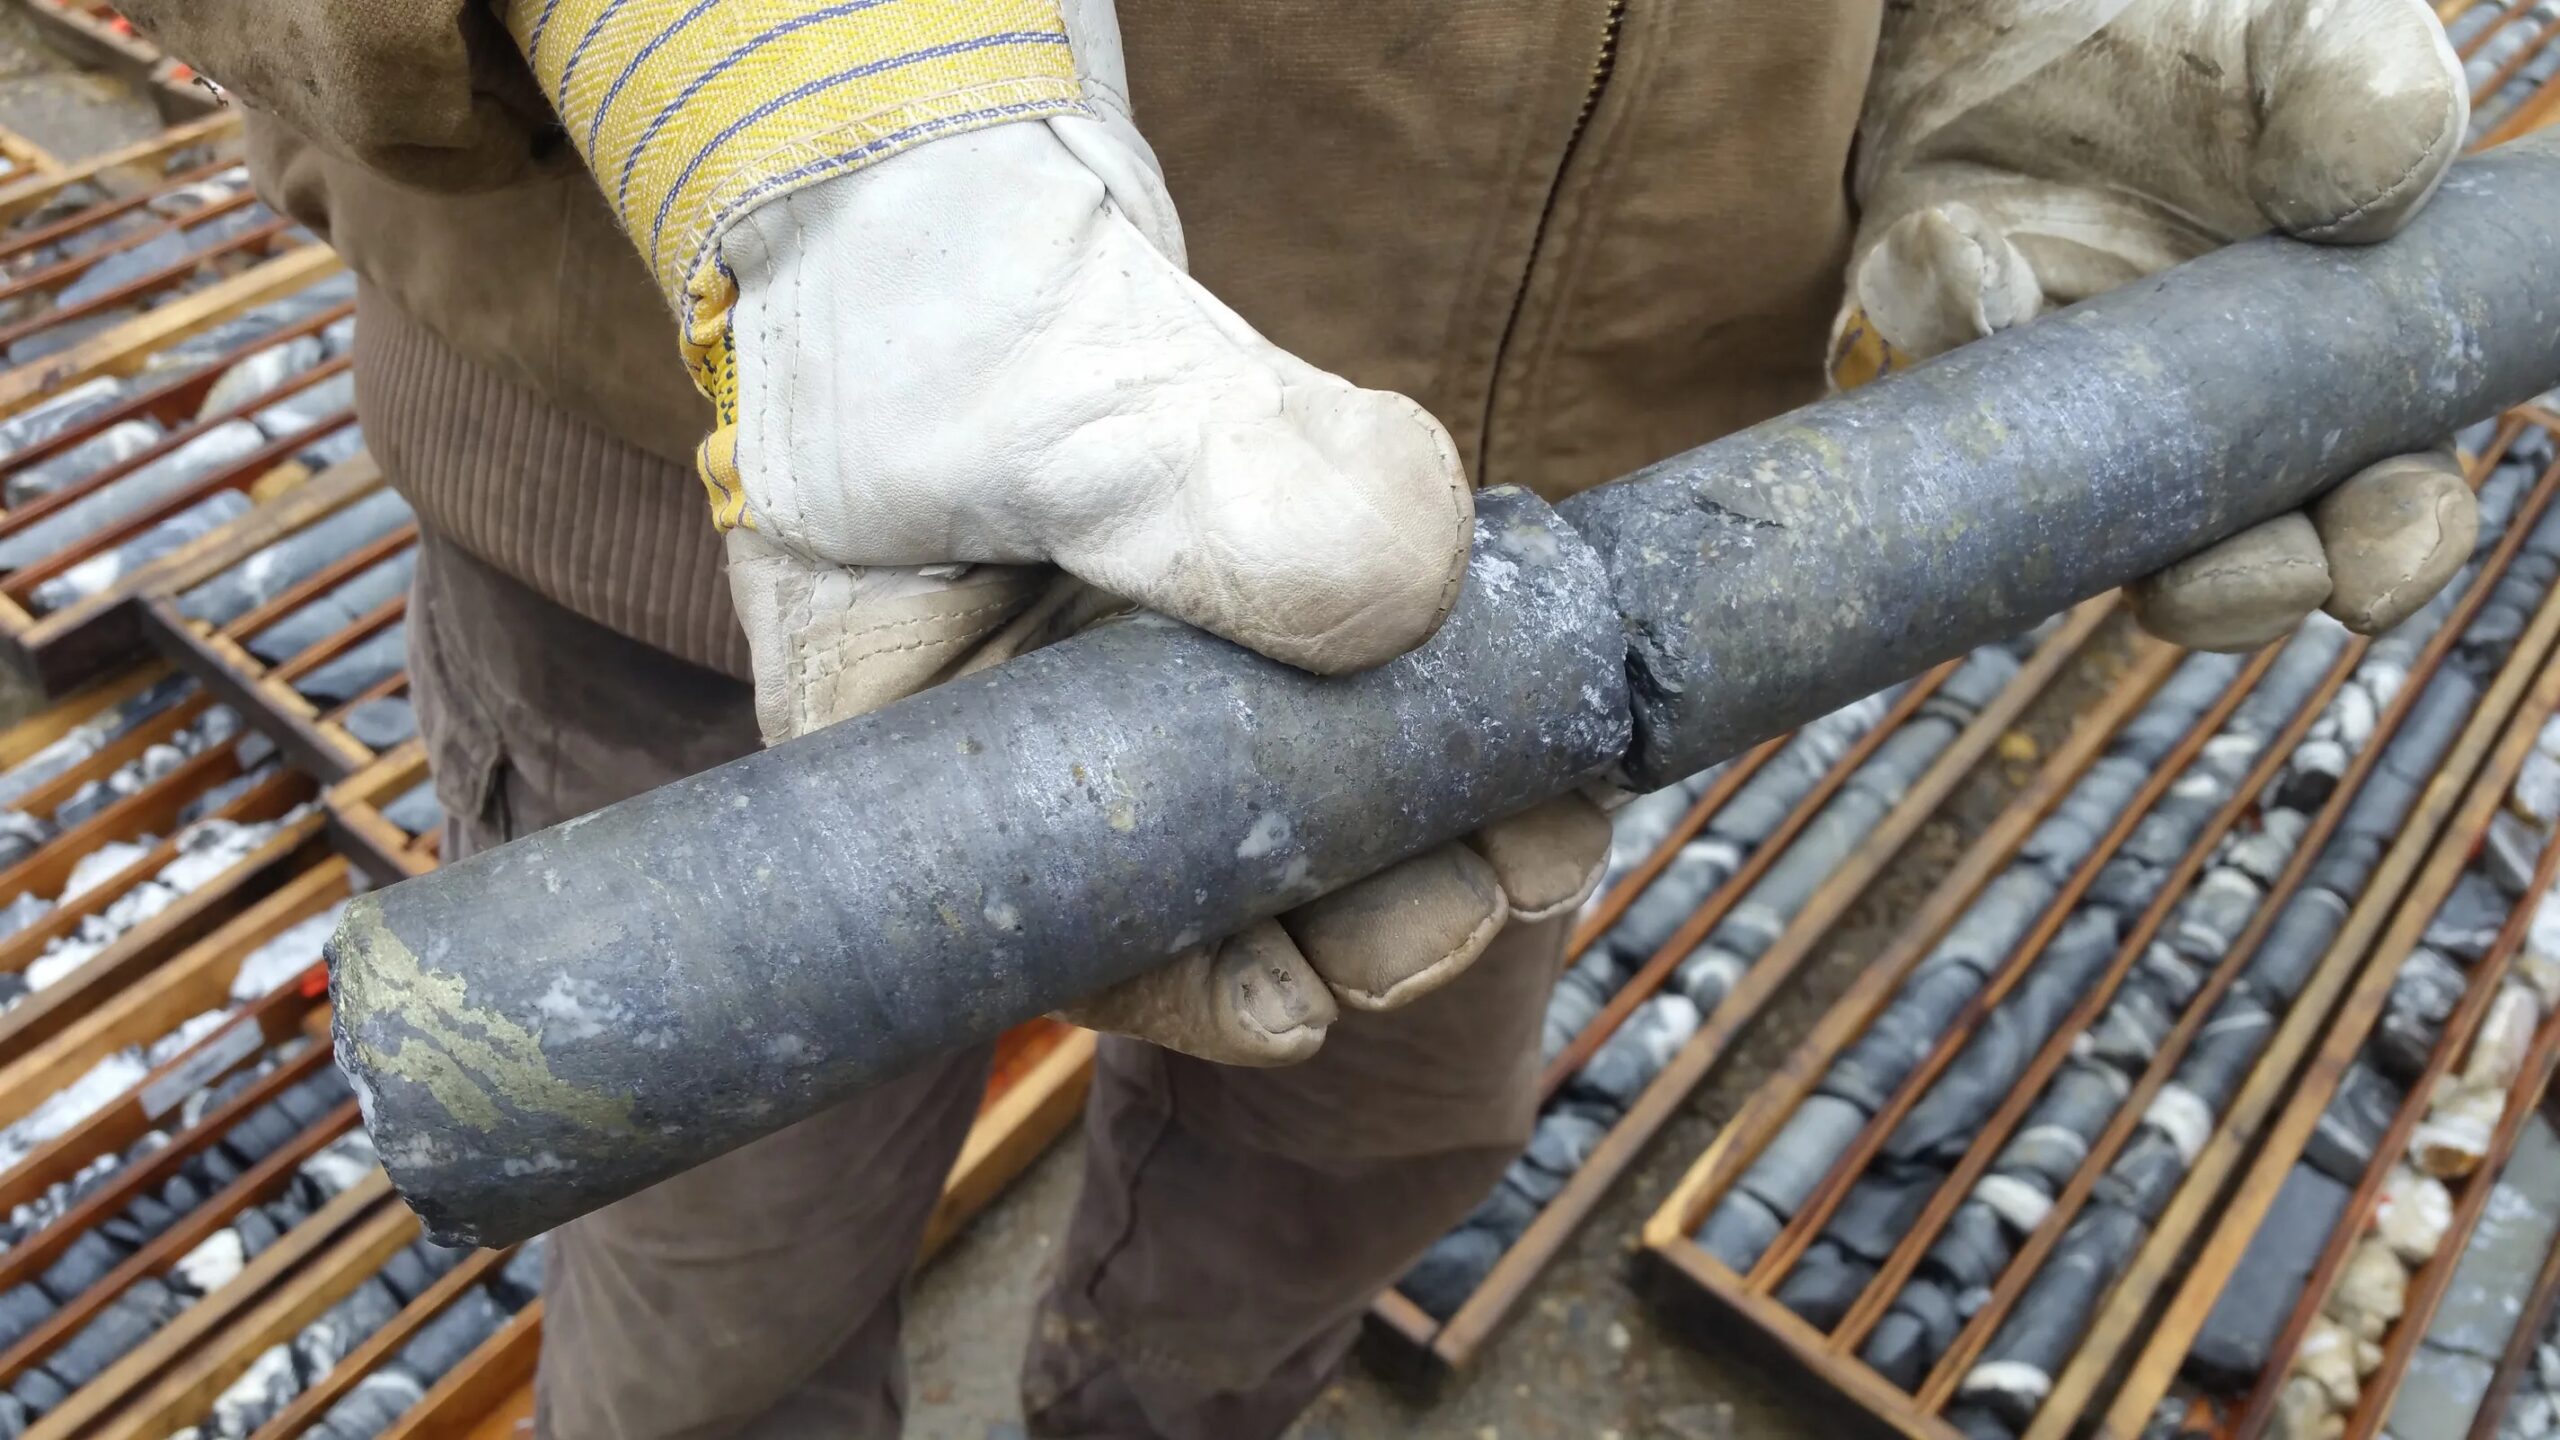
Mineralized drill core from the Thor Project
Physical drilling and sampling form the foundation of the geological model.
271modern diamond drill holes
19,750 mof modern diamond drilling
+78%reported increase in Indicated resources
+41%reported increase in Inferred resources

NI 43-101 compliant estimate

The independently prepared resource

Effective February 26, 2024 and prepared by P&E Mining Consultants Inc. Pit-constrained resources use a C$40/t NSR cut-off; out-of-pit resources use a C$120/t NSR cut-off.

Thor updated Mineral Resource Estimate Swipe horizontally to view all contained-metal columns
Thor Mineral Resource Estimate, effective February 26, 2024
Resource area Classification Tonnes
kt
Au
g/t
Ag
g/t
Cu
%
Pb
%
Zn
%
Au
koz
Ag
koz
Cu
Mlb
Pb
Mlb
Zn
Mlb
Pit-constrainedIndicated1,0370.751600.132.013.0325.15,3283.045.969.4
Inferred3390.801540.161.952.818.81,6791.214.621.0
Out-of-pitIndicated1020.70760.070.843.792.32480.21.98.5
Inferred2600.48700.141.093.924.05840.86.322.5
ConsolidatedTotal Indicated1,1390.751520.121.903.1027.45,5753.147.877.9
ConsolidatedTotal Inferred5990.661170.151.583.2912.82,2632.020.943.5
01

Reporting standard

Reported in accordance with the 2014 CIM Definition Standards and Canadian National Instrument 43-101.

02

Base-case prices

Au US$1,900/oz; Ag US$23/oz; Cu US$4.00/lb; Pb US$1.00/lb; Zn US$1.40/lb.

03

Exchange rate

A constant exchange rate of US$0.75 to C$1.00 was applied.

04

Cut-off derivation

C$40/t pit-constrained and C$120/t out-of-pit NSR cut-offs reflect stated mining, processing and G&A assumptions.

05

Pit constraint

Open-pit resources are constrained within optimized pit shells using 50-degree pit slopes.

06

Recoveries

Au 90%; Ag 90%; Cu 85%; Pb 90%; and Zn 90% for the base-case estimate.

Regulatory note: Mineral resources are not mineral reserves and do not have demonstrated economic viability. Inferred Mineral Resources have a lower level of geological confidence than Indicated Mineral Resources.

Commodity breakdown

The power of a polymetallic portfolio

Thor combines precious-metal value with zinc, lead and copper credits, creating a more diversified commodity profile than a single-metal deposit.

The project materials also report antimony, indium, cadmium and gallium occurrences. These specialty metals are not included as separate payable commodities in the MRE table below.

61%

Precious metals

Silver and gold represent the majority of the illustrative NSR commodity contribution.

39%

Base and critical metals

Zinc, lead and copper provide additional value exposure alongside reported specialty-metal occurrences.

Illustrative NSR commodity value
  • Silver43%
  • Zinc23%
  • Gold18%
  • Lead12%
  • Copper4%

Zinc sensitivity

Illustrating price exposure within the defined resource

The base-case MRE applies US$1.40/lb zinc. A simple contained-metal sensitivity at US$1.70/lb illustrates an incremental gross in-situ zinc value of approximately US$36.42 million. This is not a project valuation, revenue forecast or economic analysis.

Contained zinc
121.4 Mlb
At US$1.40/lb
US$169.96M
At US$1.70/lb
US$206.38M
Difference
+US$36.42M

Geological domains

Unifying five historic mines

Modern drilling and modelling connect the historic mine areas along a continuous 2.8-kilometre epithermal system hosted by the Thor Fault Zone.
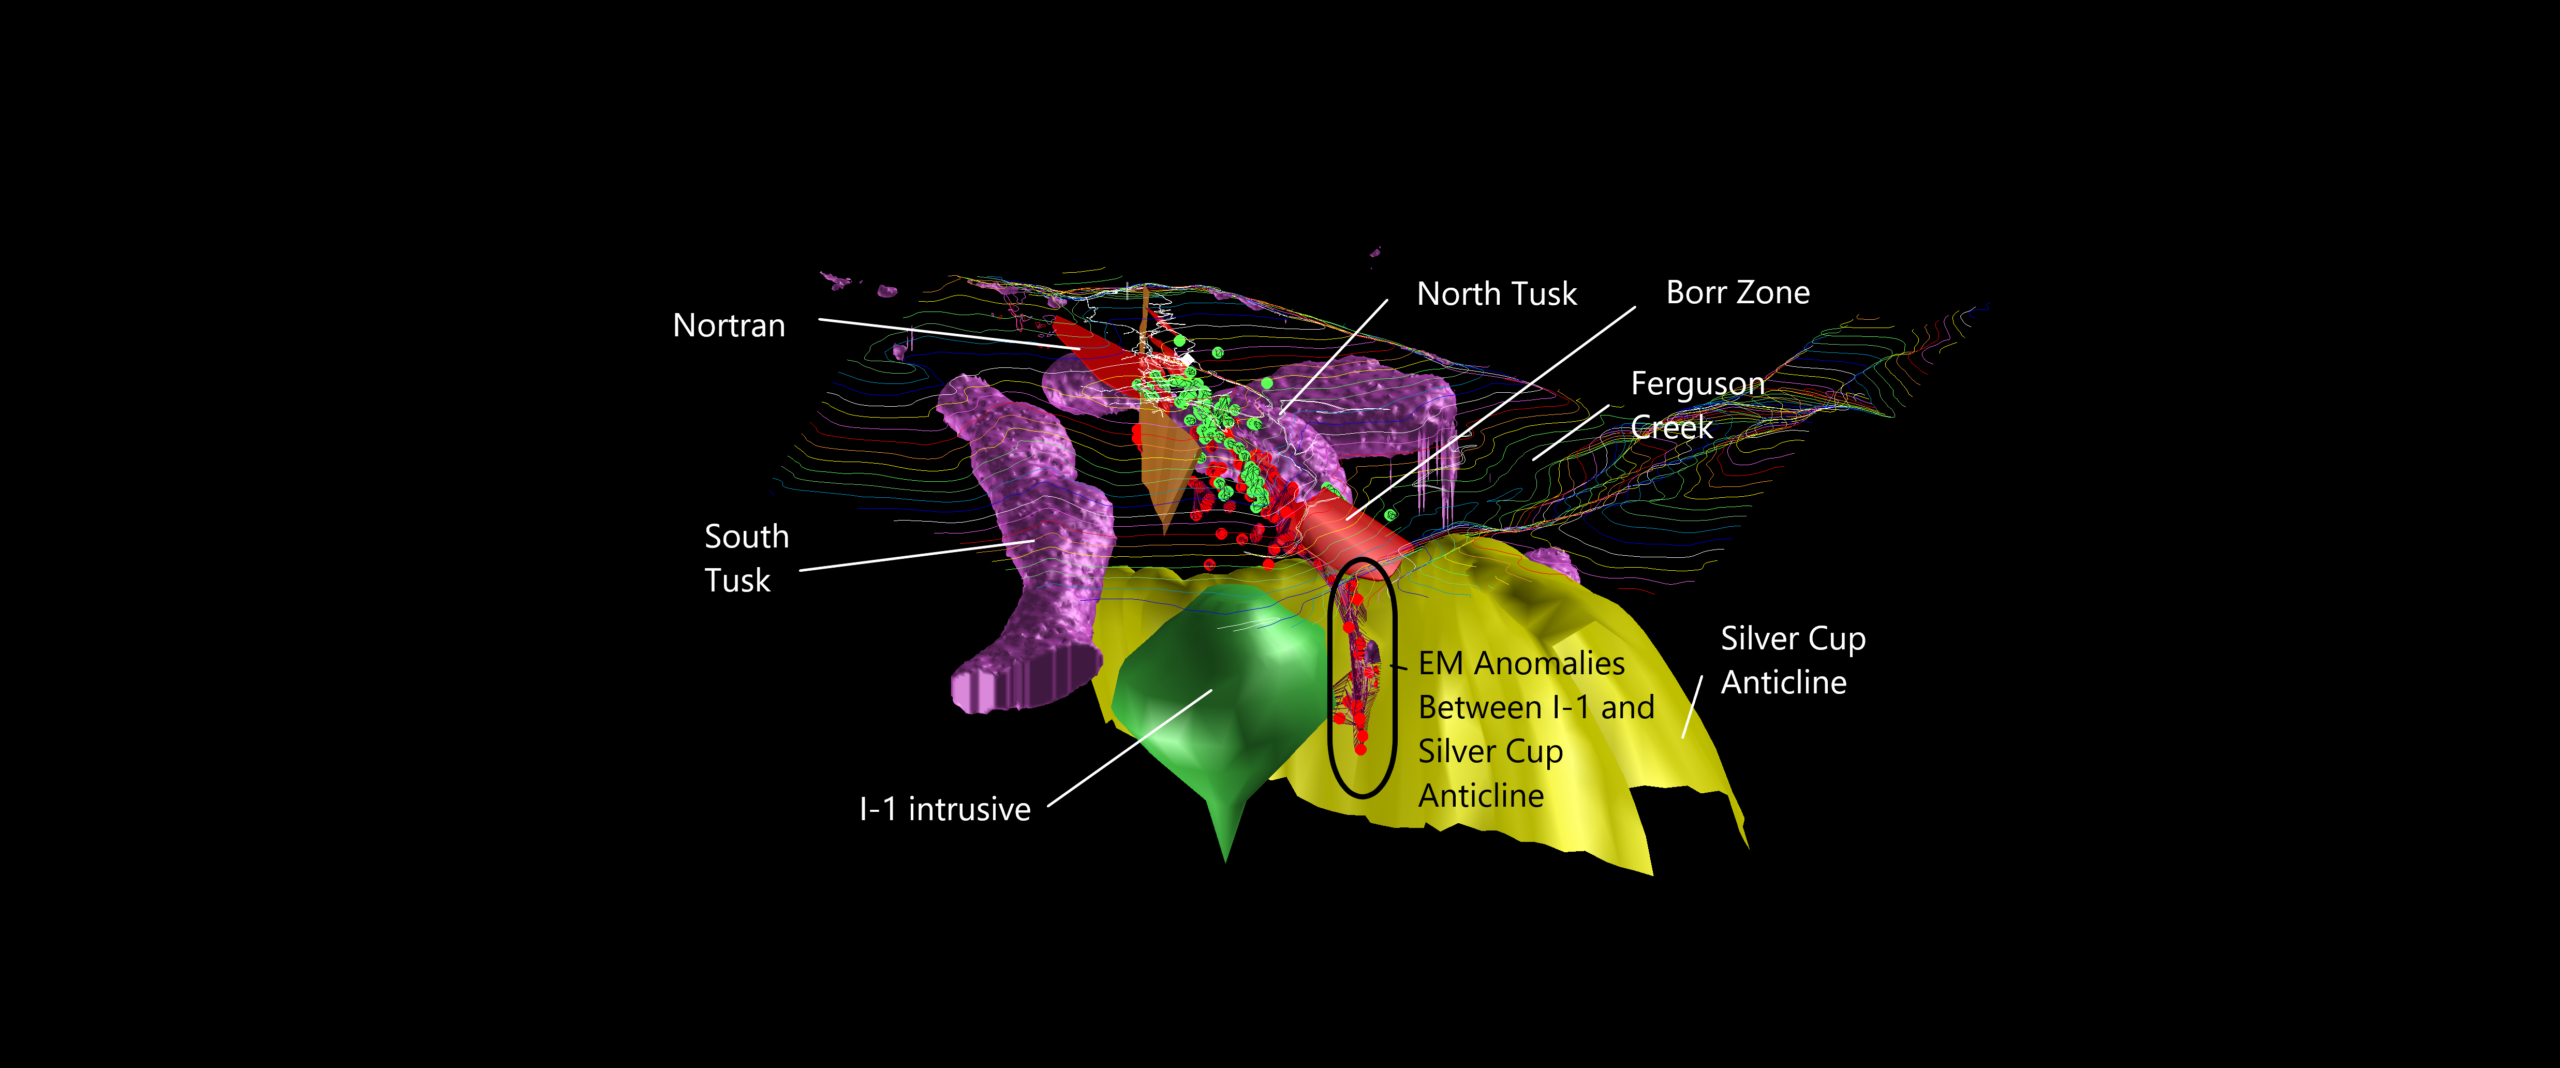
Three-dimensional geological interpretation of the Thor deposit and surrounding targets Expand geological model
The resource is confined to the classified Mineral Resource volumes. Other interpreted shapes and targets in this graphic are exploration concepts.
BV100

Broadview

GN200

Great Northern

TF300

True Fissure

BB500

Blue Bell

BB550

Thunder Zone

The structural breakthrough

From isolated workings to one connected system

Historic operators treated Broadview, Great Northern, True Fissure, Blue Bell and St. Elmo as separate narrow-vein mines. Between 1898 and 1944, these workings collectively shipped 4,931 tonnes of hand-sorted ore containing approximately 1.7 million ounces of silver and 7.8 thousand ounces of gold.

After consolidating the claims, Taranis applied drilling, mapping and geophysics to interpret the historic workings as structural panels within a single intermediate-sulfidation epithermal system.

01

Thor Fault Zone

A regional shear structure dipping approximately 45 degrees east-northeast and obliquely crosscutting the Silver Cup Anticline.

02

Near-surface geometry

The principal pit-constrained resource is highly continuous, generally one to five metres thick and occurs at or near surface.

03

Expansion potential

The system remains open northwest toward Thunder and down-dip to the east. These extensions require additional drilling.

Qualified Person

Technical oversight and disclosure

Exploration activities and technical database compilation at the Thor Project are overseen by John J. Gardiner, P.Geo., President and CEO of Taranis Resources Inc., a Qualified Person under Canadian National Instrument 43-101.

Independent report signatories

William Stone, Ph.D., P.Geo.; Fred H. Brown, P.Geo.; Jarita Barry, P.Geo.; D. Grant Feasby, P.Eng.; and Eugene Puritch, P.Eng. — P&E Mining Consultants Inc., Report No. 453.